
statistics tutorial
STATISTICS TUTORIAL
STARTING WITH A RESEARCH QUESTION
Statistical tables begin with a research question based on what we would like to know about a particular relationship. In the case of this database, the kinds of questions we asked had to do with relationships of gender and work from an international context. For example, we might ask:
“In 2011 were part-time workers more likely to be male or female in Canada, the United States, Australia and the United Kingdom?”
This tells us that:
1. gender is an important factor here (male or female)
2. we are looking for a form of employment, in this case part-time workers
3. we are looking at international data
4. time is an important factor here, in this case we are interested in the most recent year available (2011)
5. we are trying to draw a conclusion based on the relationship between them, in this case who is more (or less) likely to be working part-time
BUILDING A TABLE
To move from a research question to a statistical table, we begin with establishing variables. A variable is a property of something which can have different values. For example, a variable to answer our research question above is “sex”, which can be broken down into two parts: male and female. Each variable should be exhaustive (in other words, it covers all the ways the category can be expressed: male, female, and total – both sexes), and should be mutually exclusive (males can be differentiated from females).
SURVEY USE
Researchers then turn to national and international surveys to answer their question. The CPD uses data from seven surveys focused on the study of work, labour and employment. The CPD includes the following surveys:
Household, Income and Labour Dynamics in Australia (HILDA)
Canadian Labour Force Survey (CA LFS)
Survey of Labour and Income Dynamics (SLID)
The European Community Household Panel (ECHP)
The Survey on Income and Living Conditions (SILC)
The European Union Labour Force Survey (EU LFS)
The United States Current Population Survey (CPS)
Each survey has particular strengths and weaknesses. For example, some surveys have been discontinued, which means they are no longer being funded to operate, such as the ECHP. Other surveys are done regularly, and provide users with current up-to-date information. As much as possible the CPD uses data that can be updated easily and that provides overlap across the years of data availability to facilitate cross-national comparability. Some surveys offer more in-depth information than others about areas of interest.
For more information on the surveys and the harmonization of variables, refer to the appropriate documents found on the cpd harmonization documents page.
CHOOSING MULTIDIMENSIONAL TABLES
Each multidimensional table has a coded name to reflect the main theme of the table. For example, some tables are designed to consider demographic and social location indicators, while others are designed to map income and benefits. A multidimensional table considering demographic and social location variables will have the following coded name in brackets at the end of the short and full table title:
HSC DE-1
This code indicates that the table is specific to the health and social care module (HSC) and that it is number 1 in the series of tables on demographics and social location (DE). Tables in the forms of precarious employment module will have the following format for a similar table: FORMS DE-1. For temporal and spatial dynamics, the table code would be TSD DE-1. If users are looking for a particular theme, these codes are a helpful guide. The themes have the following codes:
Demographics and social location: DE
Household context: HC
Geography and time: GE
Work context and regulatory protection: WC
Forms of employment: FE
Income and benefits: IB
Health and social care: HS
Migration and mobility: MB
CHOOSING VARIABLES
Each module is organized so that multidimensional tables cover all of the major themes of the CPD. These themes include:
Demographics and social location (e.g. sex, age, immigrant status)
Household context (e.g. marital status, presence or absence of children)
Geography and time (e.g. year, country of residence)
Work context and regulatory protection (e.g. industry, occupation, sector)
Forms of employment (e.g. part-time, full-time, temporary, permanent, self-employed)
Income and benefits (e.g. annual average income, pension benefits)
Health and social care (e.g. disability status, absenteeism)
Migration and mobility (e.g. persons who have migrated the previous year, persons who have moved locations)
Variables are cross-tabulated to produce tables that illustrate relationships. The research question for this tutorial is: what proportion of part-time workers are women, in Canada, the United States, Australia and the United Kingdom for 2011? Below is a simple table with data related to this research question:
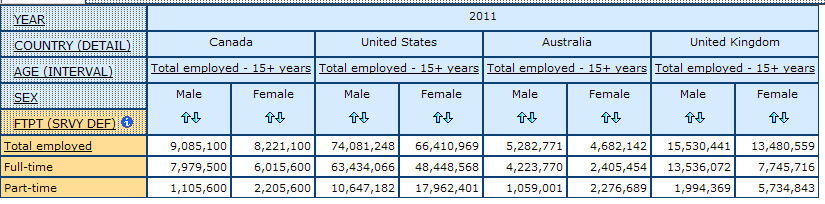
source: FORMS FE-3
In response to our research question, we can see that females are consistently more likely to be part-time workers when compared to their male counterparts, for each country in 2011.
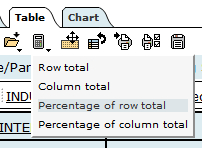
To calculate the percentages from these numbers, click on the “Total and Percentages” icon on the Table tab, located on the top left corner of the webpage, and scroll down to “Percentage of row total”, we can calculate the percentage of men and women by full-time and part-time employment.
The table below demonstrates the result with percentages calculated:
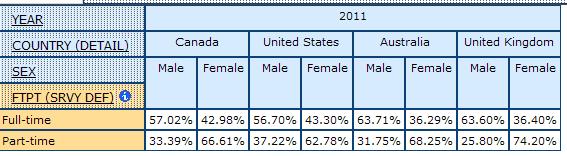
We can see that in Canada nearly 67% of part-time workers are female and approximately 33% are male. Similarly, in the United States 62% are female and in Australia 68% are female. The United Kingdom has the highest percentage of female part-time workers at 74%. From this we can conclude that part-time workers are more likely to be female. Further, these data demonstrate the importance of breaking down labour force data by gender to reveal these gendered employment patterns.
The multidimensional tables in the CPD are quite complicated as compared to the one above. Each table contains up to eight dimensions (variables). The dimensions are subdivided into smaller groups, called items. For example, in the dimension “sex”, the items are “total, male, female”. Thus, it is useful to have a clear research question before exploring the statistical tables. What relationship(s) do you want the data to highlight?
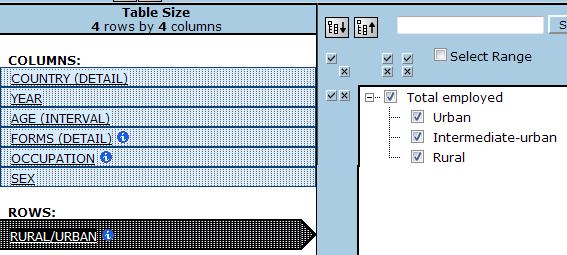
THE DEFAULT VIEW
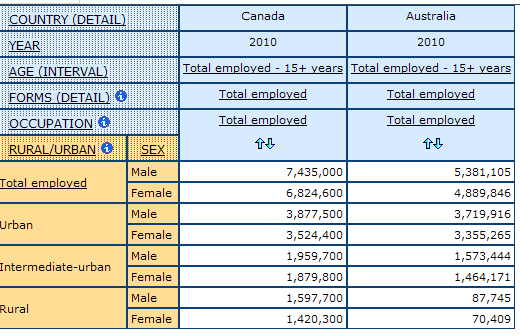
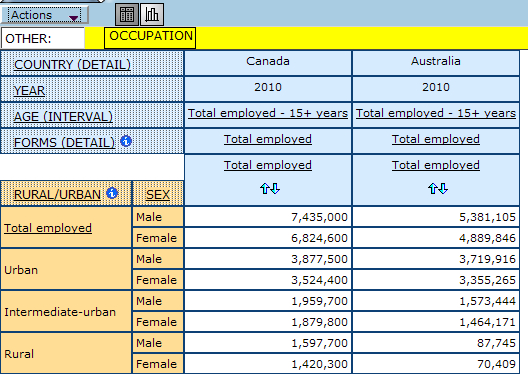
CPD tables are organized so that when users open them, the topic of the table is displayed in the most concise format. Below is a sample default table for rural and urban geography, including dimensions of country, year, age, detailed forms, occupation, and sex. In the default view, most of the variables are collapsed to their totals.
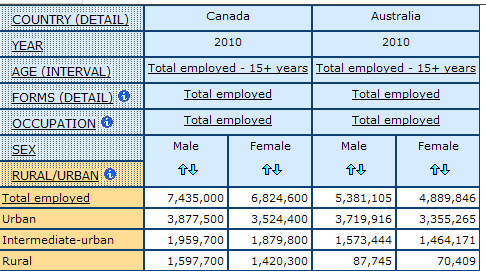
Once you have opened the table to its default view, you can then manipulate it as you would like.
MODIFYING THE TABLE LAYOUT
Each statistical table can be modified to highlight certain dimensions and items of interest, in relation to the research question. This section demonstrates how to modify tables.
Rearranging Dimensions
By default, most of the dimensions are organized on the left side of the table. The order of these dimensions can be rearranged to highlight what is of interest in the analysis. There must always be at least one dimension in the row bar and column bar. To rearrange the dimensions, click the “Set dimension order” from the Table tab. This allows users to move and modify the order of the dimensions.
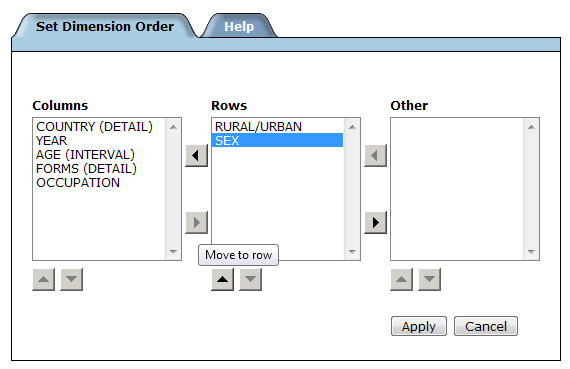
You may also want to select or deselect items to view within a table. Simply click on the dimension of interest, and select (or deselect) the desired items.
Nesting Dimensions
In some cases it may be useful to nest dimensions in order to achieve a concise visual representation. Instead of comparing laterally across the cells, the “sex” dimension can be nested within the “rural/urban” dimension.
1. Start by hovering over the “sex” dimension until the cross-arrows cursor appears, click and hold the dimension until it becomes a yellow bar.
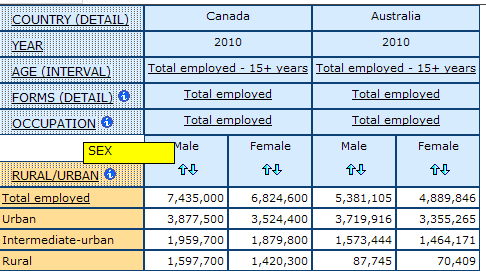
2. While holding the highlighted dimension with your cursor, drag the dimension to the dimension you want to nest it within. To nest, the yellow bar will highlight the tip of the other dimension; the yellow bar shows where it will be moved. Release the dimension to set it in place.
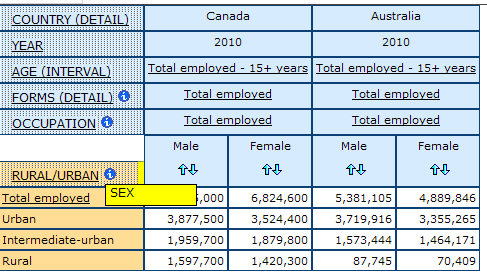
Below is an example of “sex” nested within the “rural/urban” dimension:
Charts and Graphs
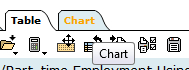
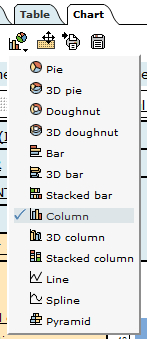
Beyond 20/20 allows for several data visualization options, including pie, column and bar charts. To create a visualization of data, select the Chart tab located on the top left side of the table, next to the Table tab.
From the Chart tab, you can modify the chart or graph by selecting the specific type you want to display your data.
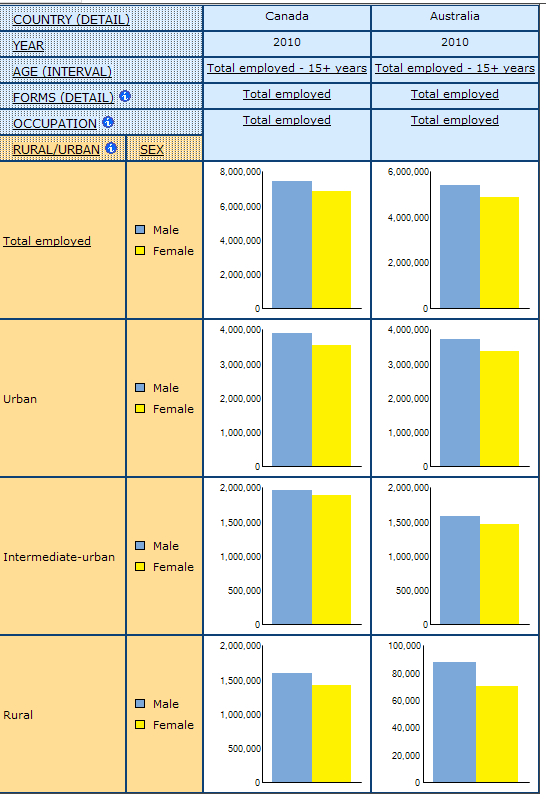
Below is an example of a column chart:
Hiding Dimensions
Unnecessary dimensions may be hidden, or removed, from table view. Before hiding any dimensions, ensure the dimension is set to the total. Start by hovering over the dimension you want to hide until the cross-arrows cursor appears; click and hold the dimension until it becomes a yellow bar. Drag the dimension to the “Other:” bar, located at the top of the table. In this example, “Occupation” is not relevant and will be removed from the table view.
Calculating Totals
In some cases, users may want to calculate a different total than what is provided in the table. Also, some multidimensional tables may not have a total calculated for a particular dimension. In this case, from the Table tab users should select “Totals and Percentages”, then click the option for “Row total” or “Column total”. Selecting either will calculate the total for the row or column, depending on which total is desired.
MISSING AND SUPPRESSED DATA
Specific symbols may appear in the table cells to signify missing, suppressed or unreliable data:
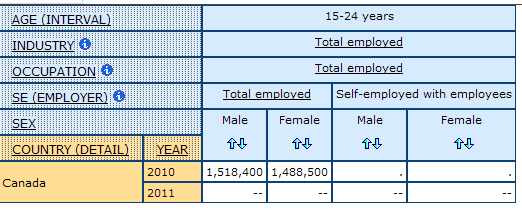
The CPD multidimensional tables contain two symbols: a double-dashed line and a single period or dot.
A double-dashed line “- -“ is used to represent no data or missing data
A single period or dot “.” is used to represent suppressed data.
Each survey has a cutoff below which data records may not be published and should be suppressed. Suppression generally occurs either because to show a small number of specific cases would compromise the anonymity of survey respondents, or because the group is too small for researchers to draw accurate conclusions from the sample. Each survey varies in its sample size and rules for suppression. For more information, consult the CPD data quality + suppression excel document for survey specific threshold limits by country and year. Note – the EU LFS suppression limits changes on an annual basis. Users should consult the Eurostat website for more detail on data publication guidelines and thresholds.
USING STATISTICAL DATA
It is essential that you are careful in how you use statistical data. First, you should think about what story you are trying to tell with the data. Numeric data does not stand alone. It needs to be interpreted through a conceptual framework which each researcher provides. What questions are you trying to answer with this data? What is the best way to apply the data to your specific needs?
Second, do not assume that because statistical data is numeric that it is truth. Be critical of how the data was obtained, and what types of questions were asked. You can click on the file and dimension summary icons in the table to find out more about how the table and dimensions were developed, what surveys were used to create the table and what are the suppression limits associated with the data in the table and become aware of the caution flags associated with that table and/or dimensions.
You should also ensure that your method of calculation is correct. If you are trying to calculate a percentage from the table make sure that you are using the correct total.
*Note: You must apply for access to the statistical tables of the Comparative Perspectives Database. See the apply for statistics access page for eligibility requirements and other information.