
statistics tutorial
STATISTICS TUTORIAL
STARTING WITH A RESEARCH QUESTION
Statistical tables begin with a research question based on what we would like to know about a particular relationship. In the case of this database, the kinds of questions we asked had to do with relationships of gender and work. For example, we might ask:
“Are part-time workers in Canada more likely to be male or female?”
This tells us that:
1. gender is an important factor here (male or female)
2. we are looking for a form of employment, in this case part-time workers
3. we are only looking at Canadian data
4. we are trying to draw a conclusion based on the relationship between them, in this case who is more (or less) likely to be working part-time
BUILDING A TABLE
To move from a research question to a statistical table, we begin with establishing variables. A variable is a property of something which can have different values. For example, a variable to answer our research question is gender (Statistics Canada uses the term “sex” for this variable). “Sex” can be broken down into two parts: male or female. Each variable should be exhaustive (in other words, it covers all the ways the category can be expressed: male, female, and both sexes), and should be mutually exclusive (males can be differentiated from females).
So, our variables to answer the above question would be:
SURVEY USE
Researchers then turn to existing Statistics Canada surveys to answer their research question. There are many Statistics Canada surveys available on a variety of topics (here is an alphabetical list). Some of the Statistics Canada surveys used to create the GWD tables are:
Census of Population
General Social Survey (GSS)
Labour Force Survey (LFS)
Survey of Labour and Income Dynamics (SLID)
Survey of Self-Employment (SSE)
Survey of Work Arrangements (SWA)
Workplace and Employee Survey (WES)
Each survey uses a different sample size. A sample is a smaller group which is selected from the whole. In this case, the whole is every person (or workplace) in Canada. A sample would be a smaller portion of that. Samples, which are randomly selected by Statistics Canada, are used because of the difficulty of surveying every single person in Canada. While samples can be applied to the population as a whole, they are not a perfectly accurate measurements, rather they are estimates of the population. Statistics using samples attempt to generalize results to the whole population. The bigger the sample size, the more likely that the results will apply more accurately to the population.
Each survey has particular strengths and weaknesses. For example, some surveys are one-time surveys, which mean they were conducted only once. Other surveys are conducted regularly. Some surveys offer in-depth information about areas of interest. For example, the Survey of Self-Employment (SSE) provides detailed data about self-employment, whereas the Workplace and Employee Survey (WES) provides detailed information about changes in employer business strategies and in the organization of work.
CHOOSING VARIABLES
The GWD includes many variables related to gender and work, including:
Social location and demographic variables (e.g. sex, age, immigrant status)
Domestic sphere and family variables (e.g. marital status, presence or absence of children)
Time and place (e.g. year, area of residence such as province or Census metropolitan area (CMA))
Workplace variables (e.g. industry, occupation)
Form of employment (e.g. part-time, full-time, temporary, permanent, self-employed)
Variables are cross-tabulated to produce tables that illustrate relationships. Our research question for this tutorial is: are part-time workers in Canada more likely to be male or female? Below is a simple table with data related to this research question:
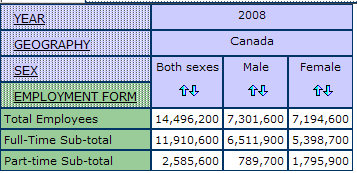
source: Labour Force Survey, 2008
In this example, the figures in the table represent the total number of employees, both full-time and part-time, male and female. The total is necessary in order to calculate a percentage (such as the percentage of female part-time employees). Out of 2,585,600 part-time workers, 789,700 are male, and 1,795,900 are female.
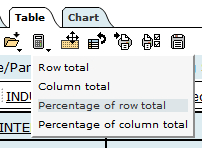
To calculate the percentages from these numbers, click on the “Total and Percentages” icon on the Table tab, located on the top left corner of the webpage, and scroll down to “Percentage of row total”, we can calculate the percentage of men and women by full-time and part-time employment.
The table below demonstrates the result with percentages calculated:
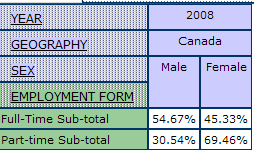
We find nearly 69% of part-time employees are female and approximately 31% are male. From this we can propose that part-time employees are more likely to be female. We can see that it is important to break down labour force data by gender to reveal these distinctive patterns of work.
The multidimensional tables in the GWD are quite complicated where, each table contains up to eight variables or dimensions. The dimensions are subdivided into smaller groups, called items. For example, in the dimension “sex”, the items are “total, male, and female”. Thus, it is useful to have a clear research question before exploring the statistical tables. What relationship(s) do you want the data to highlight?
THE DEFAULT VIEW
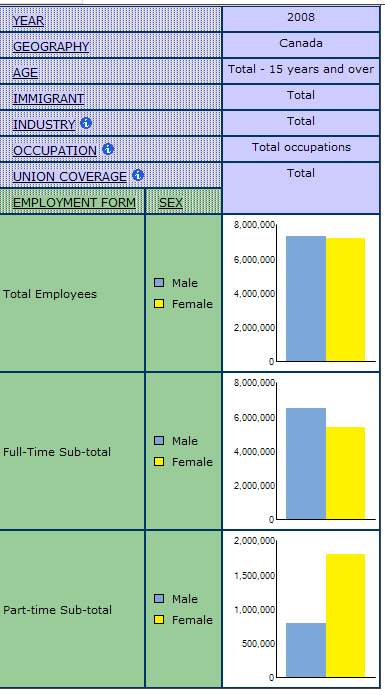
GWD tables are organized so that when users open them, the topic of the table is displayed in the most concise format. Below is a sample default view of a table for employment form, including year, geography, age, immigrant status, industry, occupation, union coverage and sex. In the default view, most of the variables are collapsed to their totals.
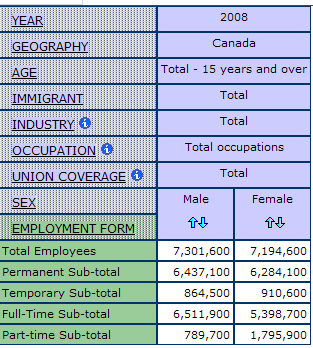
Once you have opened the table to its default view, you can then modify it as you would like.
MODIFYING THE TABLE LAYOUT
Each statistical table can be modified to highlight certain dimensions and items of interest, in relation to the research question. This section demonstrates how to modify tables.
Rearranging Dimensions
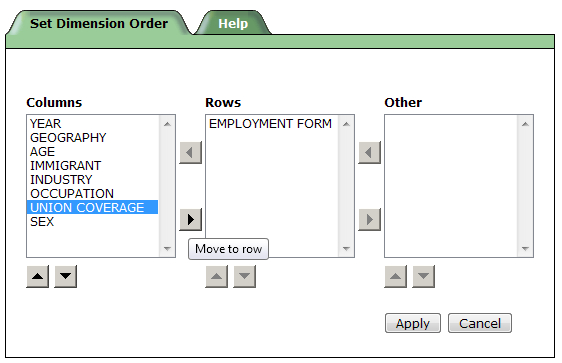
By default, most of the dimensions are organized on the left side of the table. The order of these dimensions can be rearranged to highlight what is of interest in the analysis. There must always be at least one dimension in the row bar and column bar. To rearrange the dimensions, click the “Tasks” tab, scroll down and click “Set dimension order”. This allows users to move and modify the order of dimensions.
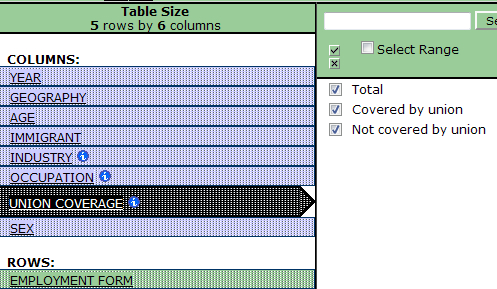
You may also want to select or deselect items to view within a table. Simply click on the dimension of interest, and select (or deselect) the desired items.
Nesting Dimensions
In some cases it may be useful to nest dimensions to achieve a concise visual representation. Instead of comparing laterally across the cells, the “sex” dimension can be nested within the “employment form” dimension.
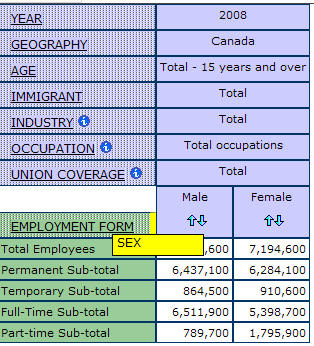
1. Start by hovering over the “sex” dimension until the cross-arrows cursor appears, click and hold the dimension until it becomes a yellow bar.
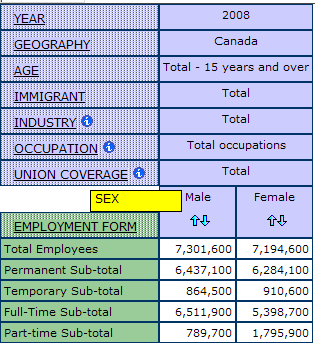
2. While holding the highlighted dimension with your cursor, drag the dimension to the dimension you want to nest it within. To nest, the yellow bar will highlight the tip of the other dimension; the yellow bar shows where it will be moved. Release the dimension to set in place.
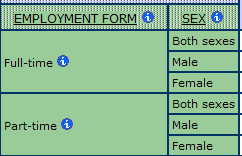
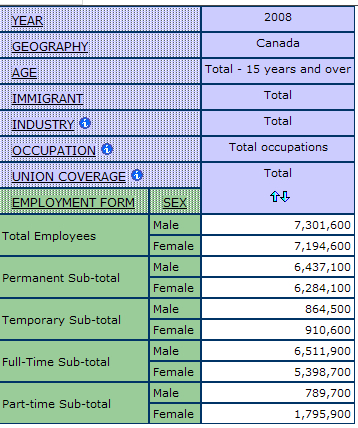
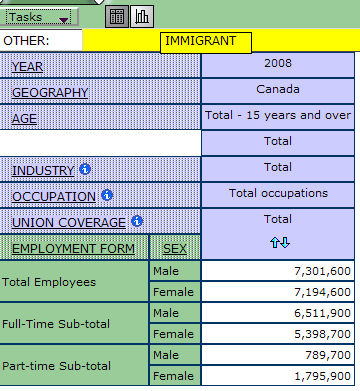
Below is an example of “sex” nested within the “employment form” dimension:
Charts and Graphs
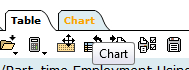
Beyond 20/20 allows for several data visualization options, including pie, column and bar charts. To create a visualization of data, select the Chart tab located at the top left side of the table, next to the Table tab.
From the Chart tab, you can modify the chart or graph by selecting the specific type you want to display your data.
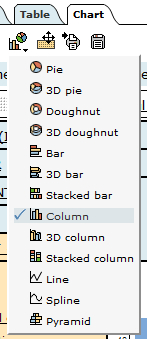
Below is an example of a column chart:
Hiding Dimensions
Unnecessary dimensions may be hidden, or removed, from table view. Before hiding any dimensions, ensure the dimension is set to the total. Start by hovering over the dimension you want to hide until the cross-arrows cursor appears; click and hold the dimension until it becomes a yellow bar. Drag the dimension to the “Other:” bar, located at the top of the table. In this example, “Immigrant” is not relevant and will be removed from the table view.
MISSING AND SUPPRESSED DATA
Specific symbols may appear in table cells to represent missing, suppressed or unreliable data. These symbols are as follows:
A lowercase “x” or capital “F” is used to represent suppressed data. The suppression of cell counts occurs when showing a small number of specific cases would compromise participant confidentiality, or the inability to draw accurate conclusions from the sample (see Confidence Intervals below).
A single period or dot “.” is used to represent missing data.
A capital E in brackets “(E)” is provided for cell counts that are flagged and should be used with caution. Cell counts above the suppression threshold are published in the statistical tables but are flagged for data quality purposes.
Zeros “0” do not necessarily signify the absence of data in the table cell. Most of the time, zeros reflect cell counts too low for the cutoff of the surveys used. Each survey has a cutoff below which it records values as zero. For example, in a survey which uses 1,500 as a cutoff, if only 1,000 data points were collected, then the value for that collection of data would be shown as a zero. Surveys vary in their cutoff levels (see Cutoffs by Survey below). A survey with a higher cutoff might show more zeros in table cells than surveys with a lower cutoff.
CONFIDENCE INTERVALS
Most surveys, since they are based on samples and not the entire population, produce data estimates. Statistics Canada decides to release data based on its confidence that the data estimate produced by studying the sample is an accurate reflection of the larger population. For example, if the data shows that 70% of the sample is employed, and Statistics Canada is confident with the accuracy of this representation to the entire Canadian population, then the data will be released.
A confidence interval is a term that describes a statistic that has a margin of error. Any survey that uses a sample instead of the whole population will have some margin of error. The goal of good data representation is to ensure that this margin is as small as possible, so that there is a high level of confidence that the numbers are fairly accurate.
i. More on Statistics Canada’s general policy on data quality standards
ii. Statistics Canada Data Quality Guidelines
CUTOFFS BY SURVEY
Each Statistics Canada survey varies in its sample size and its rules for suppression. Check the survey documentation to see if you can find more information, such as the Coefficient of Variation tables that are in most microdata file user guides.
Statistics Canada’s policy on release of data categorizes estimates as unqualified (acceptable), qualified (marginal) and not for release (unacceptable).
Unqualified: Coefficient of Variation (CV) of 0.0 to 16.5%
Estimates can be considered for general unrestricted release.
Qualified: CV of 16.6 to 33.3%
Estimates can be considered for general unrestricted release but should be accompanied by a warning cautioning users of the high sampling variability associated with the estimates. The Beyond 20/20 format did not allow us to insert cautions. In this case, it is wise to refer to additional CV tables supplied by Statistics Canada, with which to evaluate the accuracy of the estimates.
Not for release: CV of 33.4% or over
Estimates should not be released in any form under any circumstances. In statistical tables, such estimates are deleted (in the case of the GWD, zeroes appear in the tables).
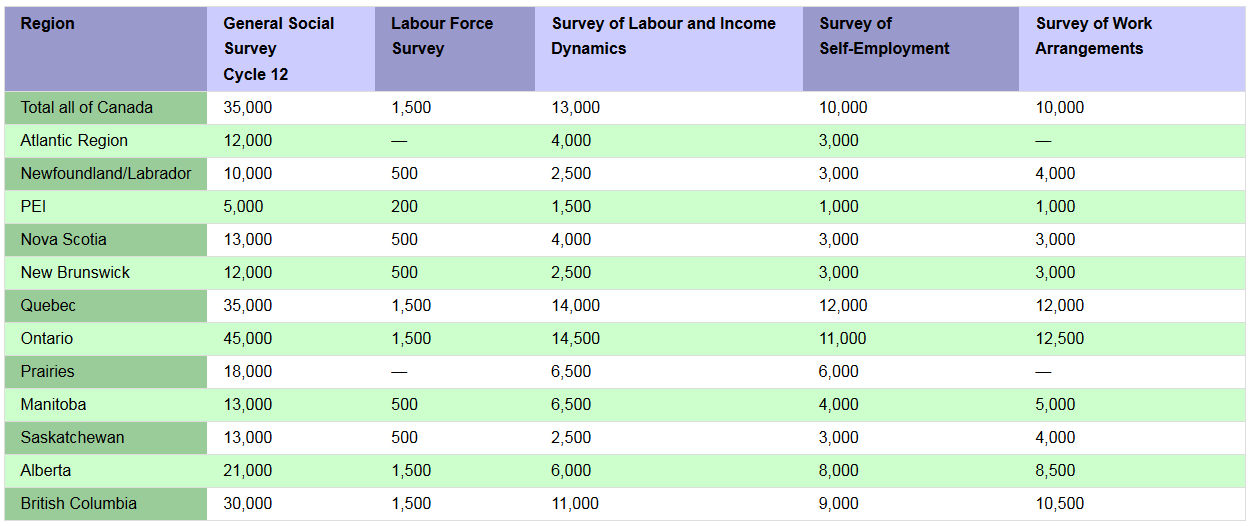
Along with survey variation, these thresholds can vary by province. For example, here are the cutoffs for various surveys used for tables in the GWD.
MINIMUM SAMPLE SIZE FOR DATA RELEASE, BY SURVEY
USING STATISTICAL DATA
It is essential that you are careful in how you use statistical data. First, you should think about what story you are trying to tell with the data. Numeric data does not stand alone. It needs to be interpreted through a conceptual framework which each researcher provides. What questions are you trying to answer with this data? What is the best way to apply the data to your specific needs?
Second, do not assume that because statistical data is numeric that it is truth. Be critical of how the data was obtained, and what types of questions were asked. You can click on the ![]() summary icon in the tables to find out more about how the variables were developed, and/or what questions were asked to obtain the results. You might also want to examine the number of people who answered “do not know” or did not answer the question in order to assess the reliability of the data.
summary icon in the tables to find out more about how the variables were developed, and/or what questions were asked to obtain the results. You might also want to examine the number of people who answered “do not know” or did not answer the question in order to assess the reliability of the data.
You should also ensure that your method of calculation is correct. For example, if you are trying to calculate a percentage from the table (such as what percentage of all part-timers in the workforce are women), make sure that you are using the correct total.
For more on using statistical data, refer to Statistics Canada’s Definitions, Data Sources, and Methods section.
*Note: You must apply for access to the statistical tables of the Gender & Work Database. See the apply for statistics access page for eligibility requirements and other details.