
statistics tutorial
STATISTICS TUTORIAL
Contents
This page provides a practical guide to using the ESD tables. For more details on the ESD harmonization process and the relevant statistical issues, please see statistics resources and the ESD codebook.
STARTING WITH A RESEARCH QUESTION
Statistical tables begin with a research question based on what we would like to know about a particular relationship. In the case of this database, the kinds of questions we asked had to do with employment standards awareness and violations. For example, we might ask:
“What is the share of men and women employees earning below the minimum wage in Ontario, Chicago, Los Angeles, New York, Australia and the United Kingdom?”
This tells us that:
1. gender and form of employment are important factors here (male or female; employees)
2. minimum wage is the employment standard under consideration
3. we are looking at international data
4. we are looking at percentages
5. we are trying to draw a conclusion based on the relationship between those that are making above and below the minimum wage, in this case who is earning below
BUILDING A TABLE
To move from a research question to a statistical table, we begin with establishing variables. A variable is a property of something which can have different values. For example, a variable to answer our research question above is “sex/gender”, which, in our data, can be broken down into two parts: male and female. Each variable should be exhaustive (in other words, it covers all the ways the category is expressed in the data: male and female*), and should be mutually exclusive (men can be differentiated from women).
*Unfortunately, the surveys used in this project did not include options other than the binary “male” or “female”, so they do not reflect the existence of gender diversity beyond this binary.
SURVEY USE
Researchers then turn to national and international surveys to answer their question. The ESD uses data from eight core surveys specifically focused on employment standards awareness and violations:
Survey of Employment Standards Compliance in Ontario (SESC)
Survey of Employment Standards Violations (SESV)
Survey of Work Problems and Actions (SWPA)
Australia at Work Survey (AWS)
Individual’s Awareness, Knowledge and Exercise of Employment Rights Survey (IAER)
Unrepresented Worker Survey (UWS)
Employees’ Awareness, Knowledge and Exercise of Employment Rights Survey (EAER)
Broken Laws, Unprotected Worker’s Survey (BLUW)
Each survey has particular strengths and weaknesses and is included in different tables depending on the information available in the survey.
For more information on the surveys and the harmonization of variables, refer to the appropriate documents found on the ESD harmonization documents page.
CHOOSING MULTIDIMENSIONAL TABLES
Each multidimensional table has a coded name to reflect the main theme of the table. For example, some tables are designed to consider demographic and social location indicators, while others are designed to map income and benefits. A multidimensional table considering demographic and social location variables will have the following coded name in brackets at the end of the short and full table title:
WG 1-A
This code indicates that the table is specific to the wage and wage compensation module (WG) and that it is number 1 in the series of table clusters (A). Tables in the working time module will have the following format for a similar table: WT 1-A. For complaints and enforcement, the table code would be CE 1-A. For Leaves, Vacation and Holidays, the table code would be LV 1-A. And, lastly, the table code pertaining to the job uncertainty module would be JU 1-A. If users are looking for a particular cluster, these codes are a helpful guide.
The clusters have the following codes:
A: Immigration and racialization status: citizenship status, visible minority status, immigration status
B: Family and education: marital status, presence of children in the household, education
C: Employment characteristics: full-time/part-time employment, establishment size, union status
D: Wages, hours, and tenure: wage/salary inflation adjusted to Canadian dollars, full-time/part-time employment, permanent/temporary employment
E: Industry and occupation: industry, occupation
Survey, year, geography, sex/gender, and age appear in all tables.
There is also a set of cross-cutting tables providing general information about employment context. These tables are designated 00. Note that the 00 tables are also named using letters (e.g., 00-A, 00-B…) but these letters do not correspond to the clusters above, and are assigned arbitrarily. The variables included in these tables are listed in the title of each table.
CHOOSING VARIABLES
Each module is organized so that multidimensional tables cover all of the major themes and indicators of the ESD. These themes include:
Geography and time (e.g. year, country, cross-sectional weight)
Demographics and social location (e.g. sex, age, immigrant status)
Job characteristics (e.g. industry, occupation)
Wage and wage compensation (e.g. rate of pay, earn minimum wage, deductions)
Hours (e.g. hours worked per week, breaks, overtime)
Complaints and enforcement (e.g. employment standards complaint, sought advice)
Leaves, vacation and holidays (e.g. public holiday leave, vacation leave)
Termination and severance (e.g. unfairly dismissed, job security)
GETTING STARTED
Upon opening the statistics web application, you will be presented with a drop-down menu for you to select a module: Employment Context; Complaints & Enforcement; Job Uncertainty; Leaves, Vacations and Holidays; Wages; and Working Time. Except for Employment Context, which provides broad, cross-cutting comparisons across basic survey variables, these correspond to the ESD modules described on this page.
After selecting a module, a drop-down menu will appear for you to select a table from that module. Each table is labelled with a code, such as CE 1-A, as described above in “Choosing Multidimensional Tables”. The code is followed by the title of that table, which informs you what issue the table focuses on, and which variables it includes.
Upon selecting a table, you can type or use the new dropdown that appears to select categorical variables to display. Once you have selected at least one variable, a table will appear to the right providing weighted counts for the variable(s) you have selected. Congratulations — you’ve created your first table!
Now that you have created a table, there are various ways to customize it for your research question.
SORTING ROWS
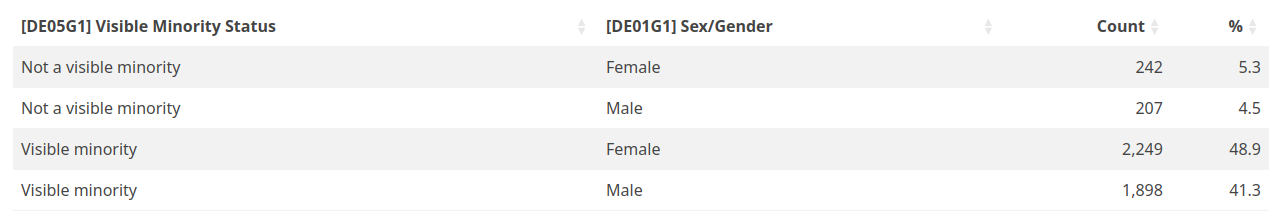
You can sort the table by one of the columns by clicking on the column header you want to sort by. After clicking once, it will be sorted in ascending order (arrow pointing upwards):

You can sort in descending order (arrow pointing downards) by clicking again:

Categorical variables are sorted in alphabetical order, while numeric variables are sorted by value.
REORDERING COLUMNS
Columns can be reordered by clicking and dragging them.
APPLYING AN ANALYSIS
In the ESD statistics application, an “analysis” is a particular way of looking at a given table.
The basic analysis has a column for each categorical variable chosen, a “Count” column that provides a weighted count for the permutation of variable categories in each row, and a “%” column that provides the percentage based on these weighted counts. This layout is sometimes referred to as tidy data and is useful for manipulation, modelling, and visualization (see “Downloading the table” below).
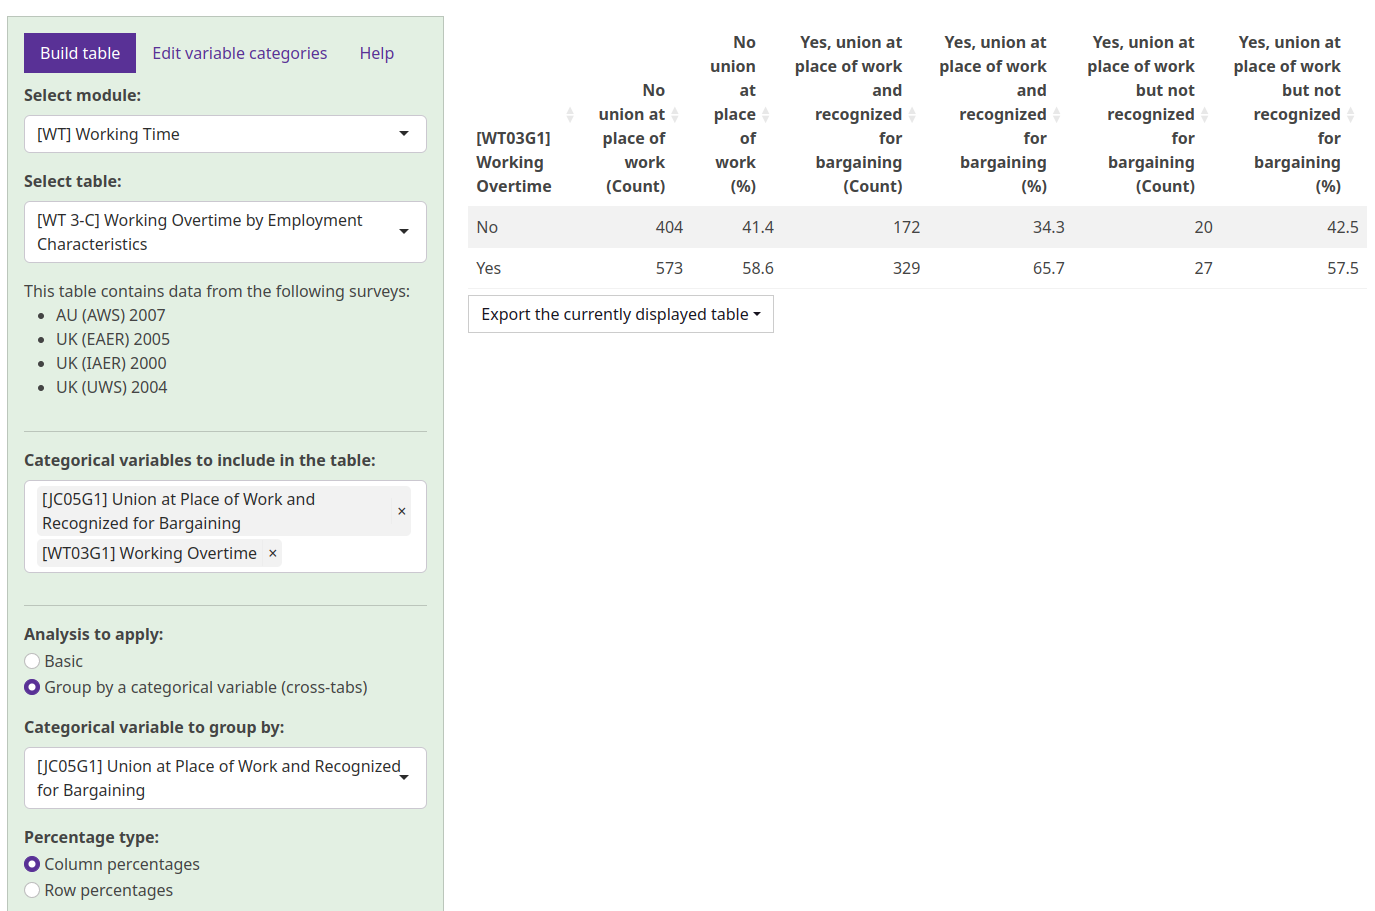
The second type of analysis that can be chosen is grouping by a categorical variable. This is also known as “cross-tabulation” or “cross-tabs”. After selecting this analysis type, a drop-down appears for you to select another categorical variable in the table for you to group by. After selecting a variable, that variable’s categories are shifted from the rows to the columns, as illustrated in the screenshot below, effectively creating a sub-group within the table. By default, the percentages shown in this view are column percentages (meaning that the values in each column sum to 100%). If you prefer row percentages (where the values in each row sum to 100%), you can adjust this using the Percentage type option that appears after you select a variable to group by.
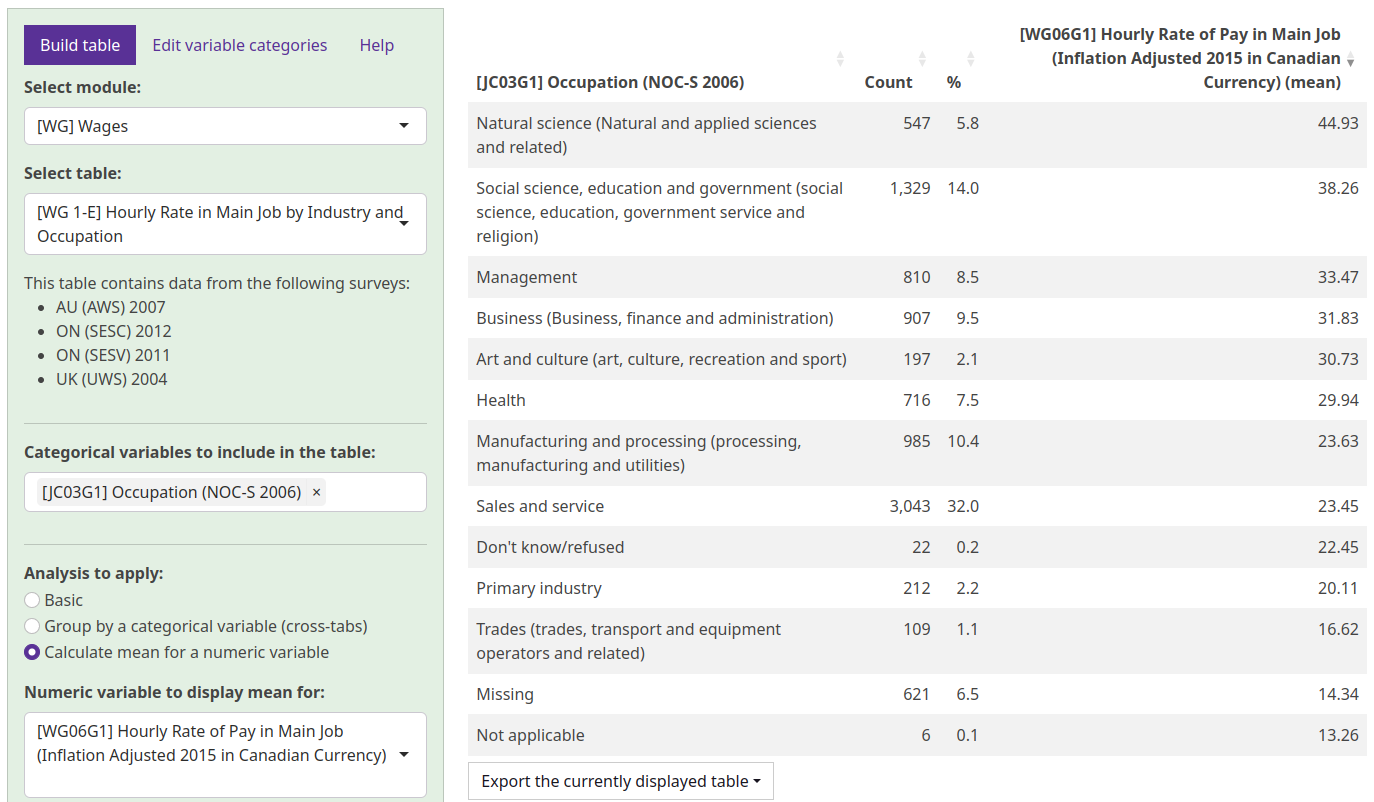
The final type of analysis that can be chosen is calculating the mean of a numeric variable. This option only appears if the table contains a numeric variable, such as those representing wages or hours worked; if you don’t see the option, it means there is no numeric variable available for the table you have chosen. After selecting this analysis type and selecting a numeric variable from the drop-down menu that appears, a new column will be added to the table that represents the mean value of the numeric variable for the permutation of variable categories in each row.
SHOWING AND HIDING VARIABLE CATEGORIES
In some cases, you may only be interested in particular categories for a given variable. One common example is removing categories associated with missing data. There are two types of missing data in the ESD. When data is simply not present, such as if a question was not asked to a particular respondent, it is coded as “missing”. When a respondent declined to answer a question, it is coded as “don’t know/refused”. If you want to exclude these categories from the table and calculate percentages based exclusively on non-missing data, you can click the Hide button in the Edit variable categories tab. This will hide all missing categories for all variables in your table. To show them again, you can click Show, which will show all missing categories for all variables in your table.
The ESD also allows more fine-grained selection of categories for individual variables. This interface is also found in the Edit variable categories tab, and it allows you to select a variable from your table and show/hide its categories individually using checkboxes. This is useful if, for example, you are only interested in data from one particular group (e.g., women) and want to hide other groups (e.g., men), or if you want to hide missing data only from particular variables.
Keep in mind that percentages are calculated based only on the categories that are included in the table. If you use percentages from a table where you have edited the variable categories, make sure you report this along with those percentages.
DOWNLOADING THE TABLE
If you are more comfortable analyzing data in an external application (such as R, Excel, or SPSS), you can download the currently-displayed table at any time as a .csv (comma-separated values) file, a .xlsx (Microsoft Excel spreadsheet), or a .pdf (portable document format), by clicking on the “Export the currently displayed table“ button.
Keep in mind that the table will be downloaded exactly as it appears on the ESD web application. That means that if you have applied a particular analysis, reordered columns, sorted the rows, or shown/hidden particular variable categories, that will also be reflected in the downloaded table. For that reason, when you download a table, you are strongly advised to make a note of any changes that you have made to the table. This will prevent you from forgetting important modifications you made that could affect your interpretation (for example, if your table is excluding missing values, or if you hid a particular level because it was not relevant), and will ensure you are able to reproduce and describe your analysis process, such as in a research paper or presentation. You are also advised to make a note of the date you downloaded the table.
USING STATISTICAL DATA
It is essential that you are careful in how you use statistical data. First, you should think about what story you are trying to tell with the data. Numeric data does not stand alone. It needs to be interpreted through a conceptual framework which each researcher provides. What questions are you trying to answer with this data? What is the best way to apply the data to your specific needs?
Second, do not assume that because statistical data is numeric that it is truth. Be critical of how the data was obtained, and what types of questions were asked. You can click on the file and dimension summary icons in the table to find out more about how the table and dimensions were developed, what surveys were used to create the table and what are the suppression limits associated with the data in the table and become aware of the caution flags associated with that table and/or dimensions.
You should also ensure that your method of calculation is correct. If you are trying to calculate a percentage based on the table, make sure that you are using the correct total. As noted above, percentages are calculated based only on the categories that are included in the table, so you should make note of which categories are included when reporting a percentage. Similarly, if you are working with downloaded data, you should make note of any changes you made prior to downloading it.
*Note: You must apply for access to the statistical tables of the Employment Standards Database. See the apply for statistics access page for eligibility requirements and other information.